|
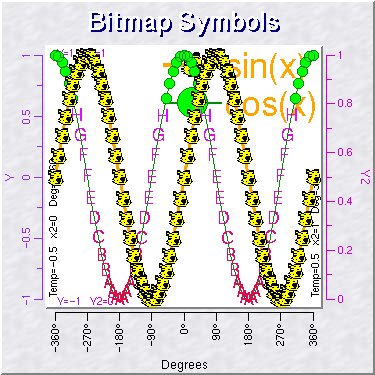
The bitmap command lets you define new bitmaps. The bitmap can be specified as a list of data or a text string which is converted into a bitmap. You can arbitrarily scale or rotate the bitmap too. |

|
|
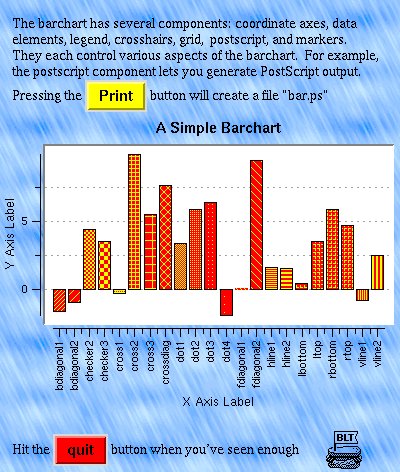
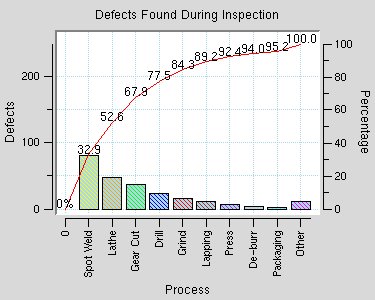
The barchart command creates a bar chart for plotting two-dimen-
sional data (X-Y coordinates). A bar chart is a graphic means of comparing numbers by displaying bars of lengths proportional to the y-coordinates of the points they represented. The bar chart has many configurable components:
They allow you to customize the look and feel of the graph. |
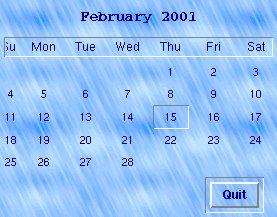
| A example of the BLT package : a calendar |
|

|
|
|
The graph command creates a graph for plotting two-dimensional
data (X-Y coordinates). It has many configurable components:
|
|
|
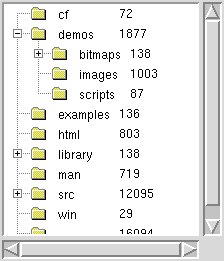
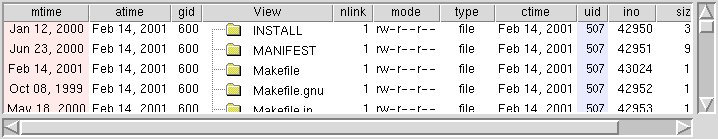
The hiertable widget that displays a hierarchy of entries, drawn
one per line. The hierarchy is a general ordered tree of entries. Each entry contains a list of subentries which in turn can contain their own lists of subentries. The lists of suben- tries can be opened (shown) or closed (hidden). Individual entries can be selected. |
|
The hiertable widget displays a scrollable tree of entries, one
entry per line. Each entry has a text label, an icon, and may have children (sub-entries). A button on the left side of the entry controls whether its children are displayed. Entries may have data fields associated with them. Data fields are displayed (as text or Tk image) in columns that can run ver- tically on either side the entry. Each column can have its own color, font, etc. Any data field, including the entry's label, can be edited in-place. Single or multiple entries can be selected. Individual entries can be hidden. There is also a find operation that can apply operations to all entries that match user-specified criteria. |
|
|
|
|
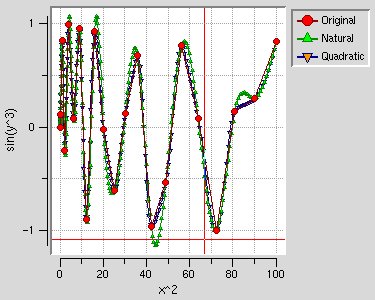
The spline command computes a spline fitting a set of data points (x and y vectors) and produces a vector of the interpolated images (y-coordinates) at a given set of x-coordinates. |
|

|
|

|